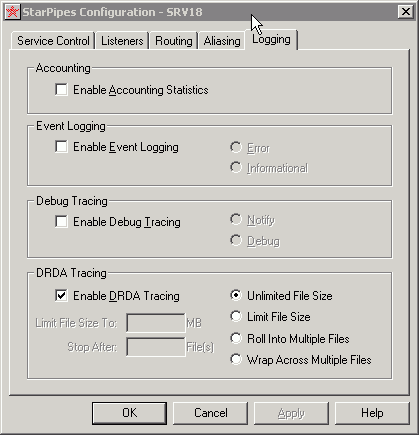
StarPipes supports several levels of status reporting. This panel in the Configuration application controls most of the StarPipes tracing and logging capabilities. However, dynamic "toggle tracing" for specific servers and/or connections, is available through the StarPipes Management Console (see Managing StarPipes).
Select a checkbox to enable:
These actions are global, and will affect all connections associated with the server you are configuring You can simultaneously select one or more of the logging or tracing options.

Selecting Enable Accounting Statistics causes StarPipes to log usage information in two files: PIPESUM and PIPEDTL. These are written to the StarQuest\StarPipes\Trace directory under \Documents and Settings\All Users\Shared Documents (Windows XP & Windows Server 2003) or under \Users\Public\Documents (Windows Vista & later). Comma delimiters separate the different field (column) values. Numeric fields will be unquoted, while strings will be double quoted. The PIPESUM and PIPEDTL files can be imported into a spreadsheet for sorting and processing.
The PIPESUM file keeps a record of all client connections and can be used for accounting purposes and to examine usage patterns. If this file already exists, StarPipes appends new records. If you track accounting information, you may want to periodically delete or rename existing files.
|
Field |
Description |
|
Connection timestamp |
Time connection started. |
|
Connection ID |
Unique ID associated with this connection. |
|
Server class |
As passed on the EXCSAT, the type of requester. |
|
Machine name |
As passed on the EXCSAT, the client's machine name. |
|
User name |
As passed on the EXCSAT, the user ID associated with the command. |
|
Computer name |
The computer name associated with this command. |
|
EXTNAM |
The value in the EXCSAT command for the "EXTNAME" (external name). |
|
DB2 user name |
The user ID connected to the host. |
|
RDB host |
The DB2 database server name. |
|
Port |
The TCP/IP port. |
|
Session |
The side information record (LLU:RLU:MODE) used to connect to the host. |
|
IP address of the client |
Either host name or IP address. |
The PIPEDTL file keeps detailed information per StarPipes connection. The file is updated when a connection terminates. If this file already exists, StarPipes will append new records.
|
Field |
Description |
|
Connection timestamp |
Time connection ended. |
|
Connection ID |
Unique ID associated with this connection. |
|
Endcode |
The end state of StarPipes. The codes are listed in Appendix A. The most common end state codes are: 0=normal end 2=APPC communications error 35=An error occurred while StarPipes was attempting to write to the TCP socket, i.e. the application terminated abnormally on the PC end. 36=An error occurred while StarPipes was attempting to read from the TCP socket, i.e. the TCP/IP connection was terminated on the Windows system |
|
DB2 user name |
The user ID connected to the host. |
|
RDB host |
The DB2 database server name. |
|
Bytes sent |
Total bytes sent by the client (PC application). |
|
Bytes received |
Total bytes received by the client (PC application). |
|
nbrccs |
Number of command chains (SQL commands) sent by StarPipes. If no command chains were sent, no connection to DB2 was established. This indicates a problem with APPC connectivity. If you see only a few command chains being sent, the problem might be a bad userid or bad password. |
|
Elapsed time |
Total time of the connection in seconds, including idle time and time waiting for DB2 to respond. |
|
Avg turn |
Average turn-around time (in seconds) for StarPipes to receive a request from the PC client and return. |
|
Avg response |
Average response time (in seconds) for StarPipes to receive data from DB2 and return data to the PC client. Subtract AVG TURN from AVG RESPONSE to calculate StarPipes processing time for the client request. |
StarPipes has the ability to log both error and informational messages which can be useful for debugging purposes. Selecting Enable Event Logging, provides the opportunity to select your logging level: Error (the default) or Informational.
The Error level causes StarPipes application errors and SNA communications errors to be written to the Windows Event Log. See StarPipes Event Codes, for a list of event codes and messages.
The Informational level logs occurrences of a connection starting and stopping to the Windows Event Log. It does not include error logging.
There are two options that you can enable to trace operations of the StarPipes server and/or to trace DRDA data streams. StarQuest Ventures Customer Support may request a trace log to help troubleshoot problems. Trace files are written to the StarQuest\StarPipes\Trace directory under \Documents and Settings\All Users\Shared Documents (Windows XP & Windows Server 2003) or under \Users\Public\Documents (Windows Vista & later).
Enable Debug Tracing. The Enable Debug Tracing option creates a detailed trace file for the StarPipes server and a distinct trace file for each active connection through that server. The trace file for the StarPipes server is called DRDAPIPE.trc. StarPipes creates a trace file for each connection, called SP<connection.id>.<timestamp>.trc. View the trace files with a text editor, such as Notepad.
When you enable the Enable Debug Tracing option you can further select a tracing level: Notify (the default) or Debug.
The Notify level traces only when the host (DB2) reports an error. It records the last command change sent by the database and client.
The Debug level traces all of the time. It provides a trace of StarPipes calls and also captures the data stream.
If tracing is turned on in the Configuration Tool, it traces on all active connections for the StarPipes Server. Debug tracing may degrade StarPipes performance. If you want to trace a specific connection, or a specific set of connections, use the StarPipes Management Console to toggle tracing on and off dynamically.
Enable DRDA Tracing. The Enable DRDA Tracing option creates a file with a .SQD extension in the StarQuest\StarPipes\Trace directory under \Documents and Settings\All Users\Shared Documents (Windows XP & Windows Server 2003) or under \Users\Public\Documents (Windows Vista & later). The filename indicates the connection ID, using the format SP-<connection.id>-<timestamp>.sqd (such as SP-0FAC-20110505-105812.093.0000.SQD). The DRDA trace files can be read by the StarSQL DRDA Trace Viewer application.
You can control the maximum size and number of DRDA trace files, as well as the ability to either wrap (re-use trace files) or stop when the maximum number of trace files have been used.
When you use the checkbox to Enable DRDA Tracing, the default will be a single file of unlimited size for each connection.
If you select the radio button for Limit File Size, then the file size field is enabled and you can enter a value in MB. When that size is reached, the trace file is closed and a new one is started; there is no maximum to to number of trace files to create.
If you select Roll into Multiple Files, you can specify both the maximum file size and the maximum number of trace files, after which tracing stops.
If you select Wrap Multiple Files, you can specify both the maximum file size and the maximum number of trace files; when the maximum number of trace files is reached, tracing continues, re-using the existing trace files.